Note
Go to the end to download the full example code.
Chromatic Imaging
This example shows how to plot color-filtered (chromatic) images from a hyperspectral dataset.
Load the data
import lumispy as lum
import hyperspy.api as hs

cl1 = lum.data.nanoparticles()

cl1.mean().plot()
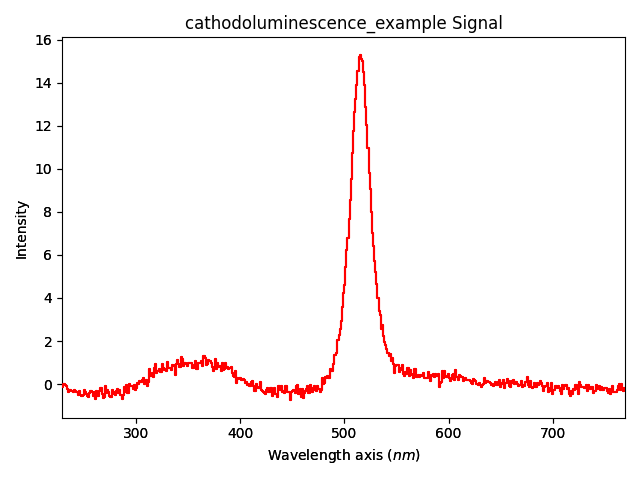
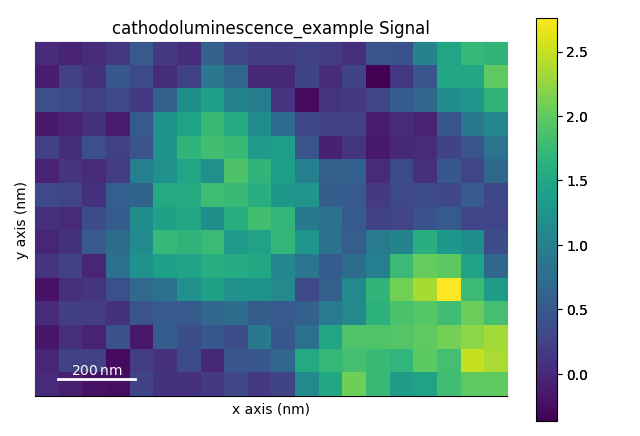
First, lets plot the panchromatic (integrated over wavelength axis) image (the object is transposed, so that we plot the intensity over navigation instead of signal dimensions).
The parameter ‘cmap’ specifies the colormap to use for plotting. See Choosing Colormaps in Matplotlib.
cl1.T.mean().plot(cmap="viridis")
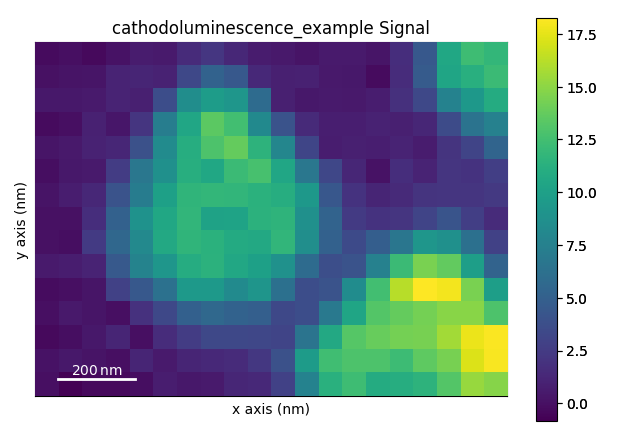
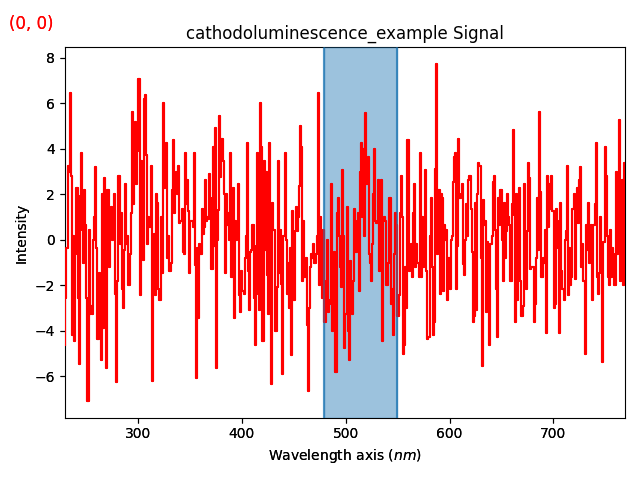
Now, we can plot the intensity in a selected spectral window (color-filtered image) using signal indexing
cl1.isig[480.0:550.0].T.mean().plot(cmap="viridis")
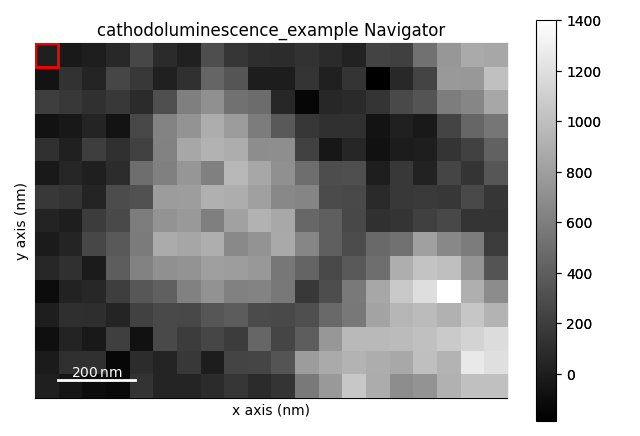
This spectral filtering can also be done interactively using hyperspy.api.plot.plot_roi_map(). Note that instead of passing explicit SpanROI objects, the parameter rois can also take an integer number, for which the corresponding number of ROIs will be initialized with default values for interactive adaptataion:
roi1 = hs.roi.SpanROI(left=480.0, right=550.0)
hs.plot.plot_roi_map(signal=cl1, rois=roi1, cmap="viridis")
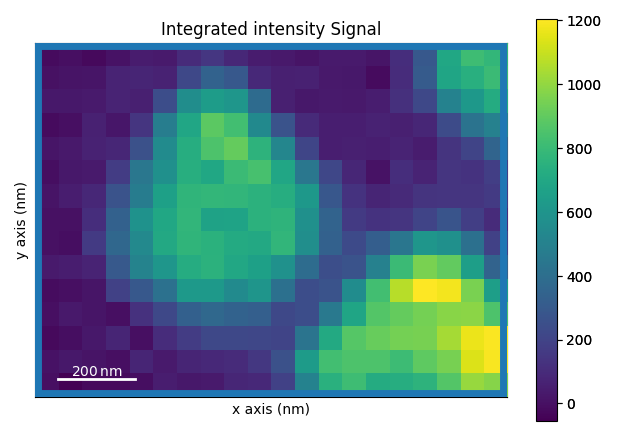
([SpanROI(left=480, right=550)], [<Signal2D, title: Integrated intensity, dimensions: (|20, 15)>])
Total running time of the script: (0 minutes 5.622 seconds)