Note
Go to the end to download the full example code.
Extraction of linescan
This example shows how to extract a linescan from a map using a region of interest (ROI).
Load the data
import lumispy as lum
import hyperspy.api as hs
import numpy as np

cl1 = lum.data.nanoparticles()

cl2 = cl1.T.mean()
cl2.data = cl2.data.astype(np.float32)
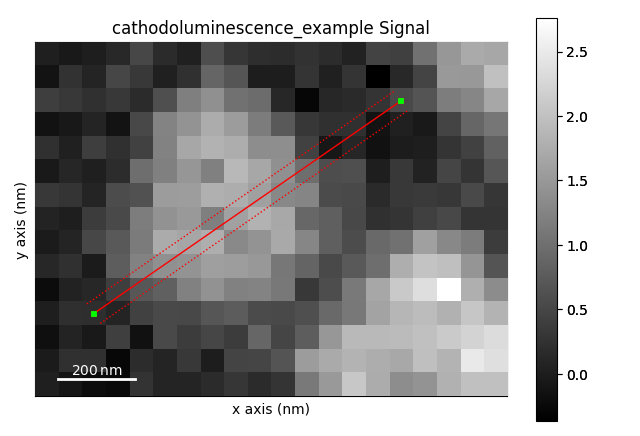
First Intialize Line-ROI (hyperspy.api.roi.Line2DROI) from position (100, 700) to position (900, 100) of width 20 in calibrated axes units
line_roi = hs.roi.Line2DROI(100, 700, 900, 100, 20)
cl2.plot()
line_roi2 = line_roi.interactive(cl2, color="red")  # to show the ROI on the plot
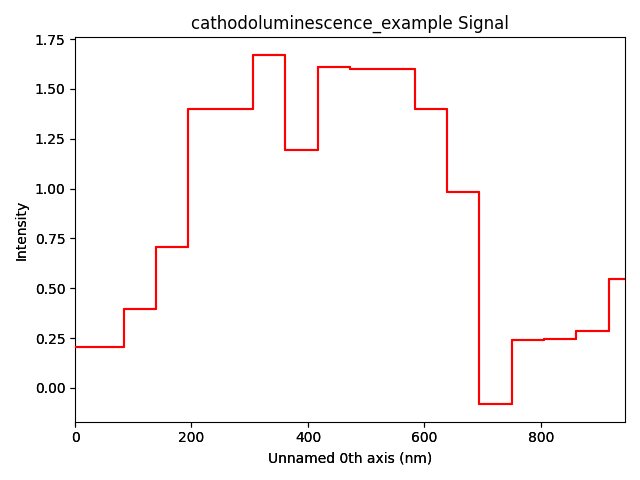
Extract data along the ROI as new signal profile by “slicing” the signal and plot the profile
Total running time of the script: (0 minutes 1.807 seconds)